A RIVER DIVERSION
NIAGARA RIVER WATER DIVERSION
The International Boundary Waters Treaty (1909)
The Niagara River Water Diversion Treaty (1950)
&
NIAGARA RIVER WATER DIVERSION & WATER OUTFLOW CHARTS
International Boundary Water Treaty (1909)
Prior to 1909, there was no bilateral international agreement between Canada and the United States pertaining to the diversion, uses and/or pollution of waters along their shared borders of the Great Lakes. There were for the most part no rules.
The two countries soon
recognized the problems associated to this lack of control and regulation and
began negotiations to remedy the problem. From these came an agreement known the "International Boundary Waters Treaty"
relating to the boundary waters and to questions arising along the boundary between Canada and the United States made between His Majesty, King Edward VII, and the United States, signed at Washington on January 11, 1909, and the protocol of May 5, 1910.
Highlights of this treaty included:
- Boundary waters are defined as the waters from main shore to main shore of the lakes and rivers and connecting waterways, or the portions thereof, along which the international boundary between the United States and the Dominion of Canada passes, including all bays, arms, and inlets thereof, but not including tributary waters which in their natural channels would flow into such lakes, rivers, and waterways, or waters flowing from such lakes, rivers, and waterways, or the waters of rivers flowing across the boundary.
- Except in accordance with a licence, no person shall use, obstruct or divert boundary waters, either temporarily or permanently, in a manner that affects, or is likely to affect, in any way the natural level or flow of the boundary waters on the other side of the international boundary.
- Subsection (1) does not apply in respect of the ordinary use of waters for domestic or sanitary purposes, or the exceptions specified in the regulations.
- No person shall use or divert boundary waters by removing water from the boundary waters and taking it outside the water basin in which the boundary waters are located.
- It is further agreed that the waters herein defined as boundary waters and waters flowing across the boundary shall not be polluted on either side to the injury of health or property on the other.
- Agree that it is expedient to limit the diversion of waters from the Niagara River so that the level of Lake Erie and the flow of the stream shall not be appreciably affected.
So long as this treaty shall remain in force, no diversion of the waters of the Niagara River above the Falls from the natural course and stream thereof shall be permitted except for the purposes and to the extent hereinafter provided.
The United States may authorize and permit the diversion within the State of New York of the waters of the said river above the Falls of Niagara, for power purposes, not exceeding in the aggregate a daily diversion at the rate of twenty thousand cubic feet of water per second.
The United Kingdom, by the Dominion of Canada, or the Province of Ontario, may authorize and permit the diversion within the Province of Ontario of the waters of said river above the Falls of Niagara, for power purposes, not exceeding in the aggregate a daily diversion at the rate of thirty-six thousand cubic feet of water per second.
The prohibitions of this article shall not apply to the diversion of water for sanitary or domestic purposes, or for the service of canals for the purposes of navigation.
Agree to establish and maintain an International Joint Commission (IJC) of the United States and Canada composed of six commissioners. This commission shall have jurisdiction over and shall pass upon all cases involving the use or obstruction or diversion of the waters.
...The Boundary Water Treaty (BWT) of 1909 first established limits on the amount of water diverted from the Niagara River for hydro-electric power production. Our two countries entered into a special agreement...the 1950 Niagara Treaty...which replaced certain paragraphs of the BWT and re-defined the diversion and division of water to protect the scenic beauty of the Falls and at the same time provide for increased hydro-electric power production. ....
Len Falkiner, Secretary, International Niagara Board of Control (IJC)
Niagara River Water Diversion Treaty (1950)
The Niagara River Water Diversion Treaty between Canada
and the United States concerning the uses of the waters of the Niagara River was
signed on February 27th 1950 and came into force October 10th 1950. Its purpose is to preserve and enhance the scenic
beauty of Niagara Falls and the Niagara River, while providing for the most
beneficial use of the river waters.
Limitations on the amount of water diverted from the Niagara River for power generation purposes initially established by the Boundary Waters Treaty of 1909 were terminated and replaced by the 1950 treaty. Temporary diversion agreements for power generation in 1941 and 1948 agreements between the two Governments were rescinded.
The Niagara River Water Treaty of 1950 established new limitations of water diversion for power generation.
The amount of water available for diversion under the provisions of the latest treaty was specified to include:
1. the total outflow from Lake Erie through the Welland Canal
2. the total outflow from lake Erie through the Niagara River (including the Black Rock Canal)
3. not to include the amount of water used and necessary for domestic/sanitary purposes and for the canals for navigation purposes.
In order to preserve the scenic beauty of the Falls, the
Niagara River Water Diversion Treaty of 1950 stipulated that no water diversions
for power generation would be allowed that would reduce the flow of water over
Niagara Falls as follows:
no less than 100,000 cubic feet of water per second (cf/s) From April 1st to September 15th (inclusive) between 8 a.m. and 10 p.m.
no less than 100,000 cubic feet of water per second (cf/s) from September 16th to October 31st (inclusive) between 8 a.m. and 8 p.m.
no less than 50,000 cubic feet of water per second (cf/s) from November 1st to March 31st (inclusive)
The specified rates of water flow over the Falls (listed above) are mandatory minimums. All water specified in this Treaty in excess of water reserved for scenic purposes may be diverted for power purposes.
On April 17th 1973, the governments agreed to use Eastern Daylight Savings Time as the basis of interpreting the hours specified by section IV of the treaty.
Under the terms of this treaty all excess waters available for water diversion for power generation shall be divided equally between Canada and the United States. An exception allows Canada to divert an additional 5,000 cubic feet of water per second from the Welland Canal or the Niagara River by a 1940 government agreement pertaining to the downstream use of waters from Canada's Long Lac and Ogoki water diversions into the Great Lakes. These water diversions are specifically excluded from the waters allocated in the Niagara River Water Diversion Treaty of 1950.
The 1950 Treaty stipulated: "Until such time as there are facilities in the territory of one party to use its full share of the diversions of water for power purposes agreed upon in this Treaty, the other party may use the portion of that share for the use of which facilities are not available".
In order to best utilize the water available for diversion, the New York State Power Authority and Ontario Power Generation signed an agreement on January 19th 1965 to share generation capacity. Both power companies have rented available power generating capacity from each other to maximize utilization of their respective shares of water available for power production. Original ownership of the water shares has been maintained. This agreement allows each company to minimize the costs of equipment outages and to provide for the handling of ice problems. In simple terms, when Ontario Power Generation (OPG) - Sir Adam Beck Power Stations (Canada) has surplus water shares available for diversion and no extra generation capacity, they rent the generation capacity available at New York State Power Authority (NYSPA) - Robert Moses Power Station for power generation. The power generated is for the use of Ontario Power Generation. This agreement is reciprocal and NYSPA does the same with their surplus water share.
The power companies of both countries continue to upgrade
their power generators to increase power capacity however their respective
abilities to draw water are limited by not only the terms of this treaty but
their capacity to draw available waters (refer below).
|
POWER STATION INTAKE CAPACITY |
|
|
Power Station Name |
Cubic Feet Per Second |
|
Robert Moses Generating Station (NYSPA) |
109,000 |
|
Sir Adam Beck Generating Stations (OPG) |
64,400 |
|
DeCew Falls Generating Station (OPG) |
8,000 |
|
Canadian Niagara Power (Fortis) - not producing |
35 |
Ontario Power Generation has a combined water drawing
capacity of 72,400 cubic feet per second (includes DeCew Falls Generating
Station). At present, New York State Power Authority - Robert Moses Generating
Station has a water drawing advantage of approximately 36,600 cubic feet per
second.
There are occasions when power generation is reduced below actual capacity at times of low water flow rates in order to maintain the treaty minimal flow over the Falls.
There are occasions when the amount of water in the Niagara River available for diversion exceeds the ability of the power stations to draw this excess. Ontario Power Generation and the Ontario Government are currently studying methods upon which to increase their water share drawing capacity in order to increase power generation capacity.
"...The two countries share the water for power production as per Article VI. This amount, of course, depends on the river flow which changes constantly. When the level of Lake Erie, and its corresponding outflow, is low, there may not be sufficient water available for maximum power generation.....in either country. On the other hand, when the opposite is true i.e. high lake levels and river flows the amount of water available for power production exceeds generation/diversion capacity and water will be "spilled" over the Falls (in other words in amounts greater than the required Falls flow minimum).
A program of unit upgrades at both Ontario Power Generation's Sir Adam Beck and the New York Power Authority's Robert Moses Niagara Power Project, begun in the 1990s and due for completion in the next couple of years has been increasing this generation/discharge capacity. While the tunnels on the U.S. side are capable of handling their diversions, in all but the most extreme case (short term storm events which can result in very high flow conditions), a new OPG tunnel or tunnels and additional generating station would increase the frequency of maximum water diversion for power generation on the Canadian side..."
Len Falkiner, Secretary, International Niagara Board of Control (IJC)
The Niagara River Water Diversion Treaty came into force upon the date of the exchange of ratifications [Oct. 10, 1950] and continues in force for a period of fifty (50) years and thereafter until one (1) year from the day on which either party shall give notice to the other party of its intention of terminating the Treaty.
Neither the Lake Erie outflow to the Niagara River nor the flow at Queenston are measured on a continuous, real-time basis. They are calculated.Values are calculated from rating tables that determine discharge from the plant generators, based on power output for the operating head, and the outflow from the Maid-of-the-Mist Pool which is determined from a rating curve for the Ashland Avenue gauge.....an equation established from field measurements and verified on a regular basis.
At this time the Welland Canal diverts 9,500 cubic feet of water per second from Lake Erie. The New York Barge (Black Rock) Canal diverts 1,100 cubic feet of water per second from the Niagara River.
At this time the Welland Canal diverts 9,500 cubic feet of water per second from Lake Erie. The New York Barge (Black Rock) Canal diverts 1,100 cubic feet of water per second from the Niagara River.
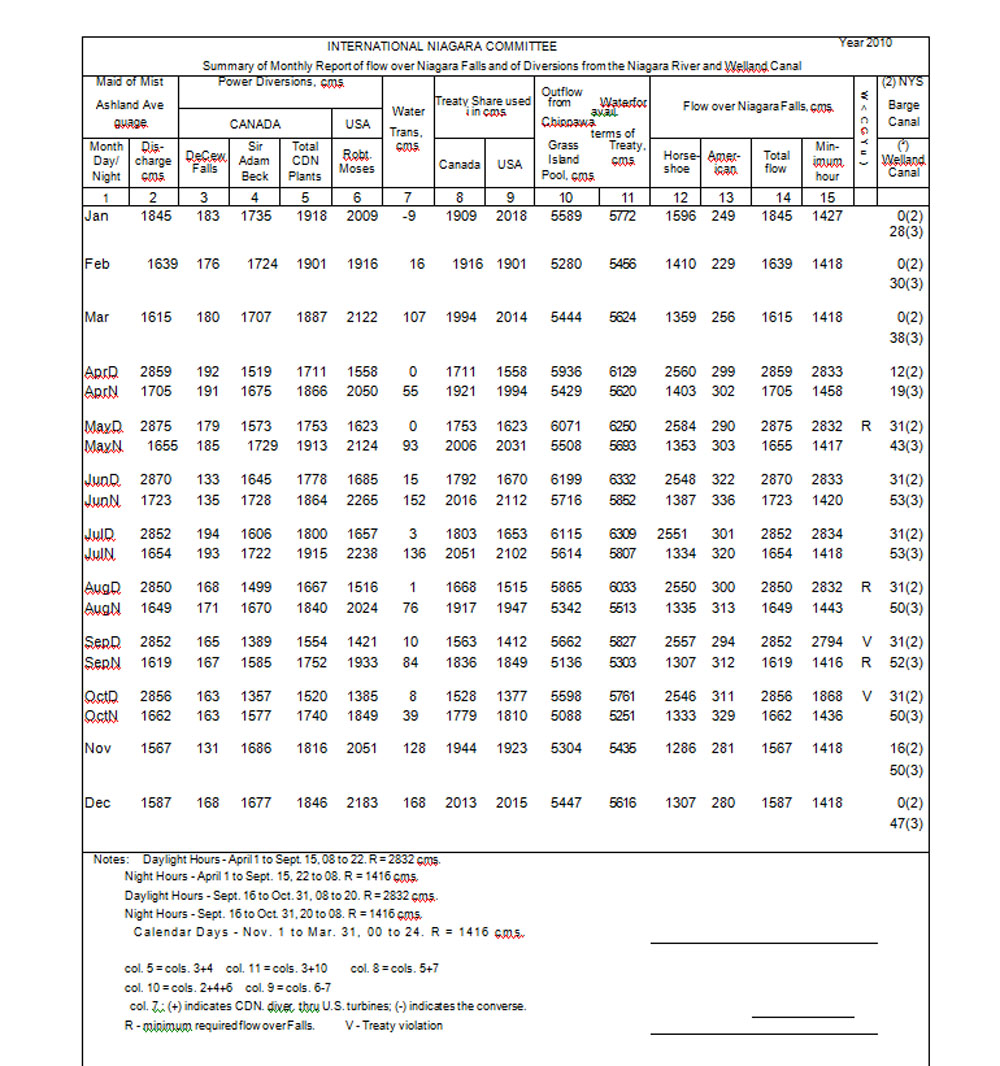
INTERNATIONAL NIAGARA COMMITTEE
NIAGARA TREATY OF 1950
The Treaty of 1950 between Canada and the United States, concerning uses of the waters of the Niagara River, was signed on February 27th, 1950. Its purpose is to preserve and enhance the scenic beauty of the Niagara Falls and River, while providing for the most beneficial use of the waters of the river.
Limitations on the amount of flow diverted from the Niagara River for power purposes specified by the Boundary Waters Treaty of 1909 were terminated by the Treaty of 1950. Also terminated were provisions pertaining to temporary diversions for power embodied in notes exchanged between the Governments in 1941 and 1948. The 1950 Treaty established new limitations governing the diversions of the water of the Niagara River for power purposes.
The amount of water available for the purposes of the Treaty of 1950 was specified to be: "the total outflow from Lake Erie to the Welland Canal and the Niagara River (including the Black Rock Canal) less the amount of water used and necessary for domestic and sanitary purposes and for the service of canals for the purpose of navigation."
To preserve the scenic spectacle of Niagara Falls, Article IV of the 1950 Treaty specifies that no diversions of water shall be made for power purposes that will reduce the flow over the Falls to less than 100,000 cubic feet per second (cfs) during the Tourist Season daylight hours which are 8:00 a.m. to 10:00 p.m. Eastern Standard Time (E.S.T.) from April 1st through September 15th, and from 8:00 a.m. to 8:00 p.m. E.S.T. from September 16th through October 31st. At all other times, the flow over the Falls shall not be less than 50,000 cubic feet per second. All Treaty water in excess of that reserved for scenic purposes may be diverted for power purposes.
By an exchange of notes between the Governments, dated April 17th, 1973, it was agreed the Treaty be interpreted to provide that Eastern Daylight Savings Time be utilized to determine the hours of flows specified in Article IV during the period when Eastern Daylight Savings Time is legally in effect in the City of Niagara Falls, New York or in the City of Niagara Falls, Ontario.
By letters dated September 8th and October 17th, 1986, the Governments of Canada and the United States, respectively, advised the International Niagara Committee that, for the terms of the Treaty, the acceptable metric equivalent of 100,000 cfs shall be 2832 cubic metres per second (m3/s) and of 50,000 cfs shall be 1416 m3/s.
Under the terms of the Treaty, all waters made available for power purposes shall be divided equally between the United States and Canada, with the exception that Canada diverts an additional 5,000 cubic feet per second (141.6 m3/s daily average applied under the metric system of measurement in use at Niagara since January 1993) from the Welland Canal or the Niagara River by virtue of an exchange of notes between the Governments in 1940 pertaining to the downstream use of waters from Canada's Long Lac and Ogoki diversions into the Great Lakes system. This amount is specifically excluded from the waters allocated under the provisions of the Treaty of 1950.
DUTIES AND CONSTITUTION
In accordance with provisions of Article VII of the 1950 Treaty, a representative was appointed by each Government: "who, acting jointly, shall ascertain and determine the amounts of water available for the purpose of this Treaty, and shall record the same, and shall also record the amounts of water used for power diversions." By an exchange of notes during January 1955, the two Governments officially designated these representatives as the International Niagara Committee (INC).
The International Niagara Committee consists of two members, one representing Canada and one representing the United States. Major General John W. Peabody of the U.S. Army Corps of Engineers' Great Lakes and Ohio River Division is the United States Member. The Canadian Member is Mr. Aaron Thompson of Environment Canada. Mr. Thompson awaits formal appointment to the Committee through an Order-in Council from the Government of Canada.
FLOW REPORTING
The International Niagara Committee's annual and monthly summaries of diversions for each calendar year are reported. For the tourist season months of April through October, separate reports are prepared for the daylight and night time hours. Monthly values of diversions to the New York State Barge Canal and the Welland Canal for non-power purposes are also reported.
To ensure accurate reporting, representatives of the International Niagara Committee conduct weekly inspections to verify the determination and recording of water use, under terms of the 1950 Treaty, for all in-service power plants. This includes the DeCew Falls and Sir Adam Beck plants, which are located in Canada, and the Robert Moses Niagara Power Project located in the United States. Readings made by the International Niagara Committee representatives compared satisfactorily with the values shown in the power company reports.
GAUGE COMPARISON
The Falls flow is determined using the outflow from the Maid-of-the-Mist Pool which is derived from a stage-discharge relationship for the Ashland Avenue gauge that is situated in the United States, downstream of Niagara Falls.
The International Niagara Committee compares daily average water levels recorded by gauges co-located at the Ashland site operated by both the U.S. National Oceanic and Atmospheric Administration (NOAA) and the Canadian and American Power Companies. Subject to the International Niagara Committee's continuing comparison of the data from these gauges, as outlined by the International Niagara Committee's directives to the power companies dated May 7th, 1969 and December 15th, 1975, the power companies gauge data are used as the official record for determining the flows over Niagara Falls.
MEASUREMENT OF WATER FLOW
Discharge measurements are regularly scheduled in the Niagara River and Welland Canal, for water management purposes, as part of a program to verify the gauge ratings used to determine flows in these channels. All measurements are obtained through joint efforts of the United States Army Corps of Engineers (USACE) and Environment Canada. Measurement programs require boat, equipment and personnel from both agencies to ensure safety, quality assurance checks between equipment and methods, and bi-national acceptance of the data collected. The USACE and Environment Canada continue efforts to standardize measurement equipment and techniques. Measurements are made at the following locations:
International Railway Bridge:
Measurements are made near the International Railway Bridge to provide
information for evaluating stage-discharge relationships for the flows entering
the Niagara River from Lake Erie. Measurements are scheduled in accordance with
a 3-year cycle. Discharge measurements were conducted near the International
Railway Bridge section in May 2010. This series was made to verify measurements
made the year before, to coordinate methods used by both countries, and to
investigate the possible effect of a moving river bed on flow measurements. A
report will be completed in 2011.
Cableway:
Measurements are made at this section, for verification of the Ashland Avenue rating equation, which is used to determine the outflow from the Maid-of-the-Mist Pool, and subsequently the flow over Niagara Falls. Measurements are usually made at this section every three years. Under the direction of the International Niagara Committee, use of the revised (2009) Ashland Avenue Gauge Rating began January 1st, 2010. Discharge measurements were conducted near the Cableway section in October 2010 to verify the Ashland Avenue gauge rating. The 2010 measurements fit the 2009 Ashland rating well with all measurement within 5% of the rating.
In
the spring of 2007, it was decided that the Acoustic Doppler Current Profiler (ADCP)
method would replace the use of the conventional flow measurement method, which
employed an aerial cable-car. The cable-car and cableway are scheduled to be
removed in the fall of 2011.
American Falls:
The American Falls Section is measured to verify the rating used to determine the amount of flow in the American Falls Channel and to demonstrate that a dependable and adequate flow of water is maintained over the American Falls and in the vicinity of Three Sisters Islands.
Since American Falls flow is directly related to the operation of the Chippawa-Grass
Island Pool, the International Niagara Board of Control monitors this
relationship. The current relationship is based on conventional flow
measurements taken from the pedestrian bridges spanning the American Falls
channel between the mainland and Goat Island. In May 2007, measurements were
successfully made using an ADCP mounted on a tethered boat at a new section
location near the American Falls gauge site. The ADCP method at this section
gave more consistent flow values than the conventional method has in the past.
The present schedule calls for the next measurements to be taken in 2012.
Welland Canal:
Discharge measurements are made in the Welland Canal to verify the rating curves for the Lock 8 supply weir at Port Colborne, Ontario where the water from Lake Erie enters the Canal. The measurement section is located upstream of the weir. In recent years, ADCP technology has been used at this section with measurements scheduled on a 3-year cycle. Scheduled measurements were made in May 2010 however, due to the St. Lawrence Seaway Management Corporation's inability to provide water level data for that time period needed to complete the 2010 program, further flow measurements will need to be scheduled for sooner than 2013.
WATER SHARING
For a number of years, New York Power Authority and Ontario Power Generation have provided each other with the opportunity to extract, at one entity's generating facilities, the potential energy from a portion of the other entity's share, to maximize utilization of each country's entitlement of treaty water available for power production. Original ownership of the water shares has been maintained. This practice has been carried out in accordance with conditions set forth in a "Memorandum of Understanding" between the two power companies, which was first signed on January 19th, 1965. In addition to maximizing power production from their respective water shares, this arrangement enables the power companies to minimize the costs of equipment outages, and to provide for expeditious handling of ice problems recognized by Article IV of the 1950 Treaty. The exchange of water sharing is reported.
Under this arrangement, not all water recorded under water transactions necessarily goes through the power plants. At times water may be spilled over the falls for ice management purposes. These amounts are recorded under “Water Transactions” because the losses are shared.
The net result was that in 2010, about 514,750 cubic metre per second-hours (m3/s-h) of Canada's share of the Niagara River water for power purposes were discharged through the Robert Moses Niagara Power Plant located in the United States. By comparison, about 637,780 m3/s-h of Canada's share were diverted through U.S. turbines in 2009. The net water transfer has consistently been from Canada to the United States because of NYPA's larger diversion capacity.
METHODOLOGY
A methodology for determining water used for navigation purposes for the Welland Canal, accepted by Transport Canada, Foreign Affairs and International Trade Canada (DFAIT), the International Niagara Committee and the St. Lawrence Seaway Management Corporation (SLSMC), was implemented beginning in 2002 and revised in 2005.
Operation under parameters defined in the methodology will ensure compliance under Article III of the Treaty. A review of the methodology began in 2010 and will be completed in 2011.
During the non-navigation period of January 1 through March 3, 2010 (which does not include canal re-filling and commissioning time), water use by the SLSMC was 11.6 m3/s. This amount was within the non-navigation season average water use limit of 12.0 m3/s set forth in the methodology.
Commercial ship transits determine the flow requirement for the Welland Canal section of the Seaway during the navigation season. The SLSMC reported a total of 3061 commercial ship transits for the 2010 navigation season of March 25th through December 30th.
Applying the agreed upon formula contained in the revised (2005) methodology, the Welland Canal flow requirement for the 2010 navigation season was 29.7 m3/s. The reported SLSMC water use for navigation (total flow through Lock 7, Weir 7 and the SLSMC powerhouse) for the 2010 navigation season was 32.3 m3/s. This is within the +/- 4.0 m3/s allowable navigation season deviation set forth in the methodology.
MINIMUM WATER FLOW
During the tourist season daylight hours, the required minimum Niagara Falls flow is 2832 m3/s. At night and during the winter months, the required minimum Falls flow is 1416 m3/s. The operation of the International Niagara Control Works, in conjunction with power diversion operations, ensures sufficient flow over the Falls to meet the requirements of the Niagara Treaty of 1950.
Any time the Falls flow is below the Treaty minimum, it is reported to the International Niagara Committee.
POWER PLANT EXPANSION AND UPGRADES
In order to increase hydroelectric generating capacity, both power companies have undertaken upgrades of their generation facilities. The upgrades by the power companies do not affect the regulation of the Chippawa-Grass Island Pool water levels as governed by the International Niagara Board of Control's directive. In addition, they do not require any modifications to other rules or regulations (such as the Niagara Treaty) relating to the diversion of water for operation of the projects.
OUTSTANDING ISSUES
By letter dated July 11th 2005, the International Niagara Committee sought clarification from the Governments of Canada and the United States on the use of water for irrigation as it relates to The Niagara Treaty of 1950 (Treaty). This request arose in response to the potential increase in use for irrigation by the Regional Municipality of Niagara of water taken from the Niagara River or the Welland Ship Canal. By subsequent letter dated May 7, 2009, the Committee wrote to the Governments in reference to its 2005 letter noting that the consideration of irrigation water by the 1950 Treaty remains pertinent. The International Niagara Committee awaits a response from the Governments.
Source: Len Falkiner, Secretary, International Niagara Board of Control (IJC)
|
|
||
|
DATE (WEEK OF) |
RATE OF FLOW |
LAKE LEVEL |
| December 4th 2003 | 210,100 | |
| December 11th 2003 | 186,500 | 570.67 feet |
| December 18th 2003 | 201,300 | 570.63 feet |
| December 26th 2003 | 204,500 | 570.70 feet |
| January 1st 2004 | 209,100 | 570.77 feet |
| January 8th 2004 | 208,400 | 570.92 feet |
| January 15th 2004 | 200,900 | 571.03 feet |
| January 22nd 2004 | 198,500 | 570.70 feet |
| January 29th 2004 | 202,000 | 570.50 feet |
| February 5th 2004 | 200,200 | 570.54 feet |
| February 12th 2004 | 190,300 | 570.47 feet |
| February 19th 2004 | 187,500 | 570.38 feet |
| February 26th 2004 | 187,900 | 570.49 feet |
| March 4th 2004 | 191,000 | 570.59 feet |
| March 11th 2004 | 203,400 | 570.80 feet |
| March 18th 2004 | 196,300 | 570.85 feet |
| March 25th 2004 | 201,600 | 570.90 feet |
| April 1st 2004 | 202,300 | 571.31 feet |
| April 15th 2004 | 205,700 | 571.33 feet |
| April 22nd 2004 | 211,500 | 571.39 feet |
| April 29th 2004 | 210,500 | 571.39 feet |
| May 6th 2004 | 211,200 | 571.45 feet |
| May 13th 2004 | 210,800 | 571.57 feet |
| May 20th 2004 | 213,300 | 571.61 feet |
| May 27th 2004 | 221,800 | 572.04 feet |
| June 3rd 2004 | 223,900 | 572.07 feet |
| June 10th 2004 | 217,900 | 572.12 feet |
| June 17th 2004 | 211,200 | 572.28 feet |
| June 24th 2004 | 218,600 | 572.20 feet |
| July 8th 2004 | 216,800 | 571.92 feet |
| July 15th 2004 | 222,000 | 571.95 feet |
| July 22nd 2004 | 220,000 | 571.88 feet |
| Aug 5th 2004 | 219,700 | 572.17 feet |
| August 12th 2004 | 216,100 | 571.82 feet |
|
Data Source - US Army Corps of Engineers - Buffalo, New York |
||
|
|
|
|
DATE |
RATE OF FLOW |
| September 2000 | 191,090 |
| October 2000 | 186,710 |
| November 2000 | 189,460 |
| December 2000 | 188,160 |
| January 2001 | 178,200 |
| February 2001 | 183,670 |
| March 2001 | 187,590 |
| April 2001 | 190,490 |
| May 2001 | 193,030 |
| June 2001 | 187,700 |
| July 2001 | 180,700 |
| August 2001 | 180,600 |
| September 2001 | 172,720 |
| October 2001 | 182,890 |
| November 2001 | 180,560 |
| December 2001 | 192,390 |
| January 2002 | 192,680 |
| February 2002 | 202,280 |
| March 2002 | 201,580 |
| April 2002 | 208,430 |
| May 2002 | 214,920 |
| June 2002 | 208,250 |
| July 2002 | 199,420 |
| August 2002 | 191,300 |
| September 2002 | 184,870 |
| October 2002 | 182,890 |
| November 2002 | 185,820 |
| December 2002 | 187,838 |
| January 2003 | 180,030 |
| February 2003 | 174,060 |
| March 2003 | 178,970 |
| April 2003 | 183,210 |
| May 2003 | 195,010 |
| June 2003 | 193,770 |
| July 2003 | 195,640 |
| August 2003 | 195,850 |
| September 2003 | 187,940 |
| October 2003 | 187,560 |
| November 2003 | 190,630 |
| December 2003 | 193,280 |
| January 2004 | 196,630 |
| February 2004 | 183,040 |
|
Data Source - International Niagara Board of Control - International Joint Commission |
|
|
NIAGARA RIVER YEARLY AVERAGE FLOW 1860 - 2000 |
|||
|
CUBIC FEET PER SECOND (CF/S) |
|||
| YEAR | MINIMUM MONTHLY FLOW | MAXIMUM MONTHLY FLOW | AVERAGE FLOW |
| 1860 | 218,985 | 252,004 | 237,172 |
| 1861 | 205,989 | 252,004 | 236,924 |
| 1862 | 224,989 | 255,995 | 241,160 |
| 1863 | 220,009 | 239,008 | 231,875 |
| 1864 | 204,012 | 239,997 | 220,265 |
| 1865 | 186,001 | 224,000 | 210,580 |
| 1866 | 189,992 | 226,013 | 214,005 |
| 1867 | 198,997 | 236,996 | 215,665 |
| 1868 | 176,996 | 230,992 | 207,825 |
| 1869 | 189,003 | 230,992 | 215,312 |
| 1870 | 217,996 | 239,997 | 230,003 |
| 1871 | 201,010 | 230,003 | 216,583 |
| 1872 | 182,011 | 204,965 | 196,006 |
| 1873 | 179,009 | 227,002 | 209,732 |
| 1874 | 207,014 | 230,992 | 220,503 |
| 1875 | 183,000 | 215,983 | 204,682 |
| 1876 | 208,991 | 255,006 | 236,924 |
| 1877 | 202,988 | 224,000 | 217,360 |
| 1878 | 215,983 | 236,996 | 226,401 |
| 1879 | 201,999 | 217,996 | 208,496 |
| 1880 | 205,989 | 223,011 | 214,076 |
| 1881 | 188,014 | 226,013 | 210,262 |
| 1882 | 214,995 | 243,988 | 230,815 |
| 1883 | 205,989 | 243,988 | 226,436 |
| 1884 | 217,008 | 245,012 | 227,990 |
| 1885 | 192,994 | 242,010 | 226,083 |
| 1886 | 208,991 | 239,997 | 228,334 |
| 1887 | 213,017 | 242,010 | 225,836 |
| 1888 | 192,676 | 220,998 | 210,721 |
| 1889 | 192,994 | 217,996 | 205,671 |
| 1890 | 210,015 | 240,986 | 221,068 |
| 1891 | 189,992 | 208,002 | 200,339 |
| 1892 | 170,004 | 224,989 | 200,586 |
| 1893 | 176,007 | 224,989 | 200,762 |
| 1894 | 188,014 | 218,985 | 199,986 |
| 1895 | 169,015 | 186,990 | 178,832 |
| 1896 | 166,013 | 195,995 | 182,152 |
| 1897 | 173,994 | 211,004 | 194,582 |
| 1898 | 195,007 | 214,995 | 210,151 |
| 1899 | 181,658 | 208,002 | 194,900 |
| 1900 | 185,048 | 205,883 | 195,642 |
| 1901 | 169,863 | 189,992 | 182,823 |
| 1902 | 167,037 | 210,121 | 193,452 |
| 1903 | 187,167 | 217,890 | 205,459 |
| 1904 | 174,100 | 230,957 | 207,775 |
| 1905 | 180,104 | 222,834 | 203,411 |
| 1906 | 187,873 | 209,062 | 202,316 |
| 1907 | 199,880 | 226,013 | 213,793 |
| 1908 | 198,114 | 230,957 | 212,557 |
| 1909 | 183,988 | 220,009 | 200,656 |
| 1910 | 173,041 | 209,062 | 193,412 |
| 1911 | 169,863 | 194,936 | 184,306 |
| 1912 | 170,922 | 208,002 | 196,984 |
| 1913 | 203,058 | 239,079 | 215,912 |
| 1914 | 181,163 | 216,831 | 199,103 |
| 1915 | 174,100 | 199,880 | 188,085 |
| 1916 | 188,932 | 222,834 | 204,082 |
| 1917 | 179,044 | 234,135 | 212,098 |
| 1918 | 185,048 | 206,943 | 199,809 |
| 1919 | 198,114 | 229,897 | 211,569 |
| 1920 | 149,027 | 204,824 | 191,687 |
| 1921 | 186,107 | 215,065 | 198,961 |
| 1922 | 171,982 | 210,827 | 192,923 |
| 1923 | 165,978 | 194,936 | 180,351 |
| 1924 | 171,982 | 200,939 | 188,826 |
| 1925 | 157,856 | 180,104 | 171,028 |
| 1926 | 139,845 | 197,055 | 170,851 |
| 1927 | 169,863 | 203,058 | 185,577 |
| 1928 | 179,044 | 209,062 | 194,724 |
| 1929 | 187,873 | 247,908 | 220,574 |
| 1930 | 193,170 | 234,841 | 215,736 |
| 1931 | 165,978 | 185,048 | 177,243 |
| 1932 | 167,037 | 193,170 | 181,092 |
| 1933 | 157,856 | 193,877 | 172,581 |
| 1934 | 140,905 | 158,915 | 152,134 |
| 1935 | 143,024 | 168,097 | 157,008 |
| 1936 | 115,831 | 175,866 | 159,550 |
| 1937 | 173,041 | 206,943 | 187,272 |
| 1938 | 157,856 | 197,055 | 183,670 |
| 1939 | 165,978 | 199,880 | 184,412 |
| 1940 | 158,915 | 199,174 | 181,763 |
| 1941 | 169,863 | 185,048 | 177,208 |
| 1942 | 159,975 | 199,880 | 188,367 |
| 1943 | 183,988 | 238,020 | 211,004 |
| 1944 | 187,167 | 221,069 | 201,080 |
| 1945 | 175,160 | 220,009 | 208,143 |
| 1946 | 193,877 | 216,831 | 204,153 |
| 1947 | 177,985 | 224,023 | 209,309 |
| 1948 | 193,170 | 232,016 | 209,697 |
| 1949 | 180,104 | 204,118 | 194,053 |
| 1950 | 194,936 | 218,950 | 203,799 |
| 1951 | 200,939 | 232,016 | 215,383 |
| 1952 | 212,946 | 251,086 | 231,415 |
| 1953 | 204,824 | 224,953 | 217,113 |
| 1954 | 193,877 | 228,838 | 214,888 |
| 1955 | 204,118 | 236,960 | 220,468 |
| 1956 | 181,163 | 222,128 | 202,528 |
| 1957 | 185,048 | 212,946 | 197,690 |
| 1958 | 171,982 | 188,932 | 180,739 |
| 1959 | 164,919 | 197,055 | 182,339 |
| 1960 | 182,929 | 212,946 | 198,644 |
| 1961 | 179,044 | 224,953 | 200,233 |
| 1962 | 169,863 | 193,877 | 181,092 |
| 1963 | 155,031 | 185,048 | 169,615 |
| 1964 | 139,139 | 182,929 | 160,822 |
| 1965 | 152,912 | 182,929 | 171,204 |
| 1966 | 174,100 | 197,055 | 185,330 |
| 1967 | 180,104 | 205,883 | 193,841 |
| 1968 | 192,111 | 214,006 | 206,236 |
| 1969 | 198,114 | 236,996 | 218,808 |
| 1970 | 195,995 | 218,950 | 209,132 |
| 1971 | 204,824 | 226,013 | 212,240 |
| 1972 | 204,824 | 236,960 | 228,237 |
| 1973 | 232,016 | 263,093 | 247,024 |
| 1974 | 223,894 | 264,859 | 242,151 |
| 1975 | 232,016 | 245,083 | 236,995 |
| 1976 | 223,046 | 257,019 | 236,183 |
| 1977 | 189,992 | 227,990 | 214,182 |
| 1978 | 202,988 | 236,996 | 217,325 |
| 1979 | 196,984 | 233,005 | 220,998 |
| 1980 | 217,008 | 242,999 | 230,850 |
| 1981 | 201,010 | 229,014 | 219,585 |
| 1982 | 207,014 | 237,984 | 220,927 |
| 1983 | 214,995 | 239,997 | 227,672 |
| 1984 | 211,357 | 233,005 | 226,330 |
| 1985 | 199,986 | 261,009 | 240,173 |
| 1986 | 224,000 | 268,002 | 252,002 |
| 1987 | 217,008 | 252,958 | 237,172 |
| 1988 | 198,008 | 220,009 | 207,684 |
| 1989 | 186,001 | 224,000 | 204,753 |
| 1990 | 192,994 | 220,998 | 211,004 |
| 1991 | 193,170 | 226,013 | 211,110 |
| 1992 | 191,051 | 228,838 | 213,123 |
| 1993 | 212,593 | 243,670 | 227,036 |
| 1994 | 199,527 | 231,663 | 215,171 |
| 1995 | 199,974 | 219,656 | 210,085 |
| 1996 | 194,583 | 226,013 | 215,887 |
| 1997 | 230,604 | 260,268 | 244,658 |
| 1998 | 199,174 | 251,439 | 230,886 |
| 1999 | 184,695 | 207,296 | 193,735 |
| 2000 | 173,747 | 210,999 | 188,493 |
|
NIAGARA RIVER 140 YEAR AVERAGE FLOW = 207,838 CUBIC FEET PER SECOND |
|||
|
|
|||
Ontario Power Generation are upgrading their generators at Sir Adam Beck Generating Station #2 that will increase the total generating capacity by approximately 148 megawatts (MW). The New York State Power Authority have upgraded the generators at Robert Moses Generating Station which increased the maximum output of each from 175 megawatts to 200 megawatts. This upgrade has increased the generation capacity from 2,275 MW to 2,600 MW.
To learn more about the history of hydro-electric power generation visit The History of Power
Here are more Educational Web Sites about this subject, please visit:
International Joint Commission
International Niagara Board of Control
US Army Corps of Engineers - Buffalo
| NIAGARA FALLS THUNDER ALLEY NAVIGATOR | ||
| SITE MAP | ||
THANK YOU FOR VISITING THE
A RIVER DIVERSION
NIAGARA RIVER WATER DIVERSION
PAGE